Kubeshark AddOn¤
kubeshark is an API Traffic Analyzer for Kubernetes providing real-time, protocol-level visibility into Kubernetes’ internal network, capturing and monitoring all traffic and payloads going in, out and across containers, pods, nodes and clusters.
This pattern deploys the following resources: - Creates EKS Cluster Control plane with managed nodegroup - Install and set up kubeshark
Prerequisites:¤
Ensure that you have installed the following tools on your machine.
Project Setup¤
1.) Clone the repository
git clone https://github.com/aws-samples/cdk-eks-blueprints-patterns.git
2.) Go inside project directory (eg. cdk-eks-blueprints-patterns)
cd cdk-eks-blueprints-patterns
3.) Install project dependencies.
make deps
4.) import kubeshark
npm i kubeshark
make list
cdk bootstrap
make pattern kubeshark deploy
Verify the resources¤
Run update-kubeconfig command. You should be able to get the command from CDK output message. More information can be found at https://aws-quickstart.github.io/cdk-eks-blueprints/getting-started/#cluster-access
aws eks update-kubeconfig --name <your cluster name> --region <your region> --role-arn arn:aws:iam::xxxxxxxxx:role/eks-blue1-eksblue1AccessRole32C5DF05-1NBFCH8INI08A
1.) verify the resources created by Steps above.
$ kubectl get deployments -n kube-system

NAME                                                          READY   UP-TO-DATE   AVAILABLE   AGE
blueprints-addon-kubeshark                               1/1     1            1           20m
2.) Access to kubeshark.
$ kubectl -n kube-system port-forward svc/kubeshark-front 3000:80
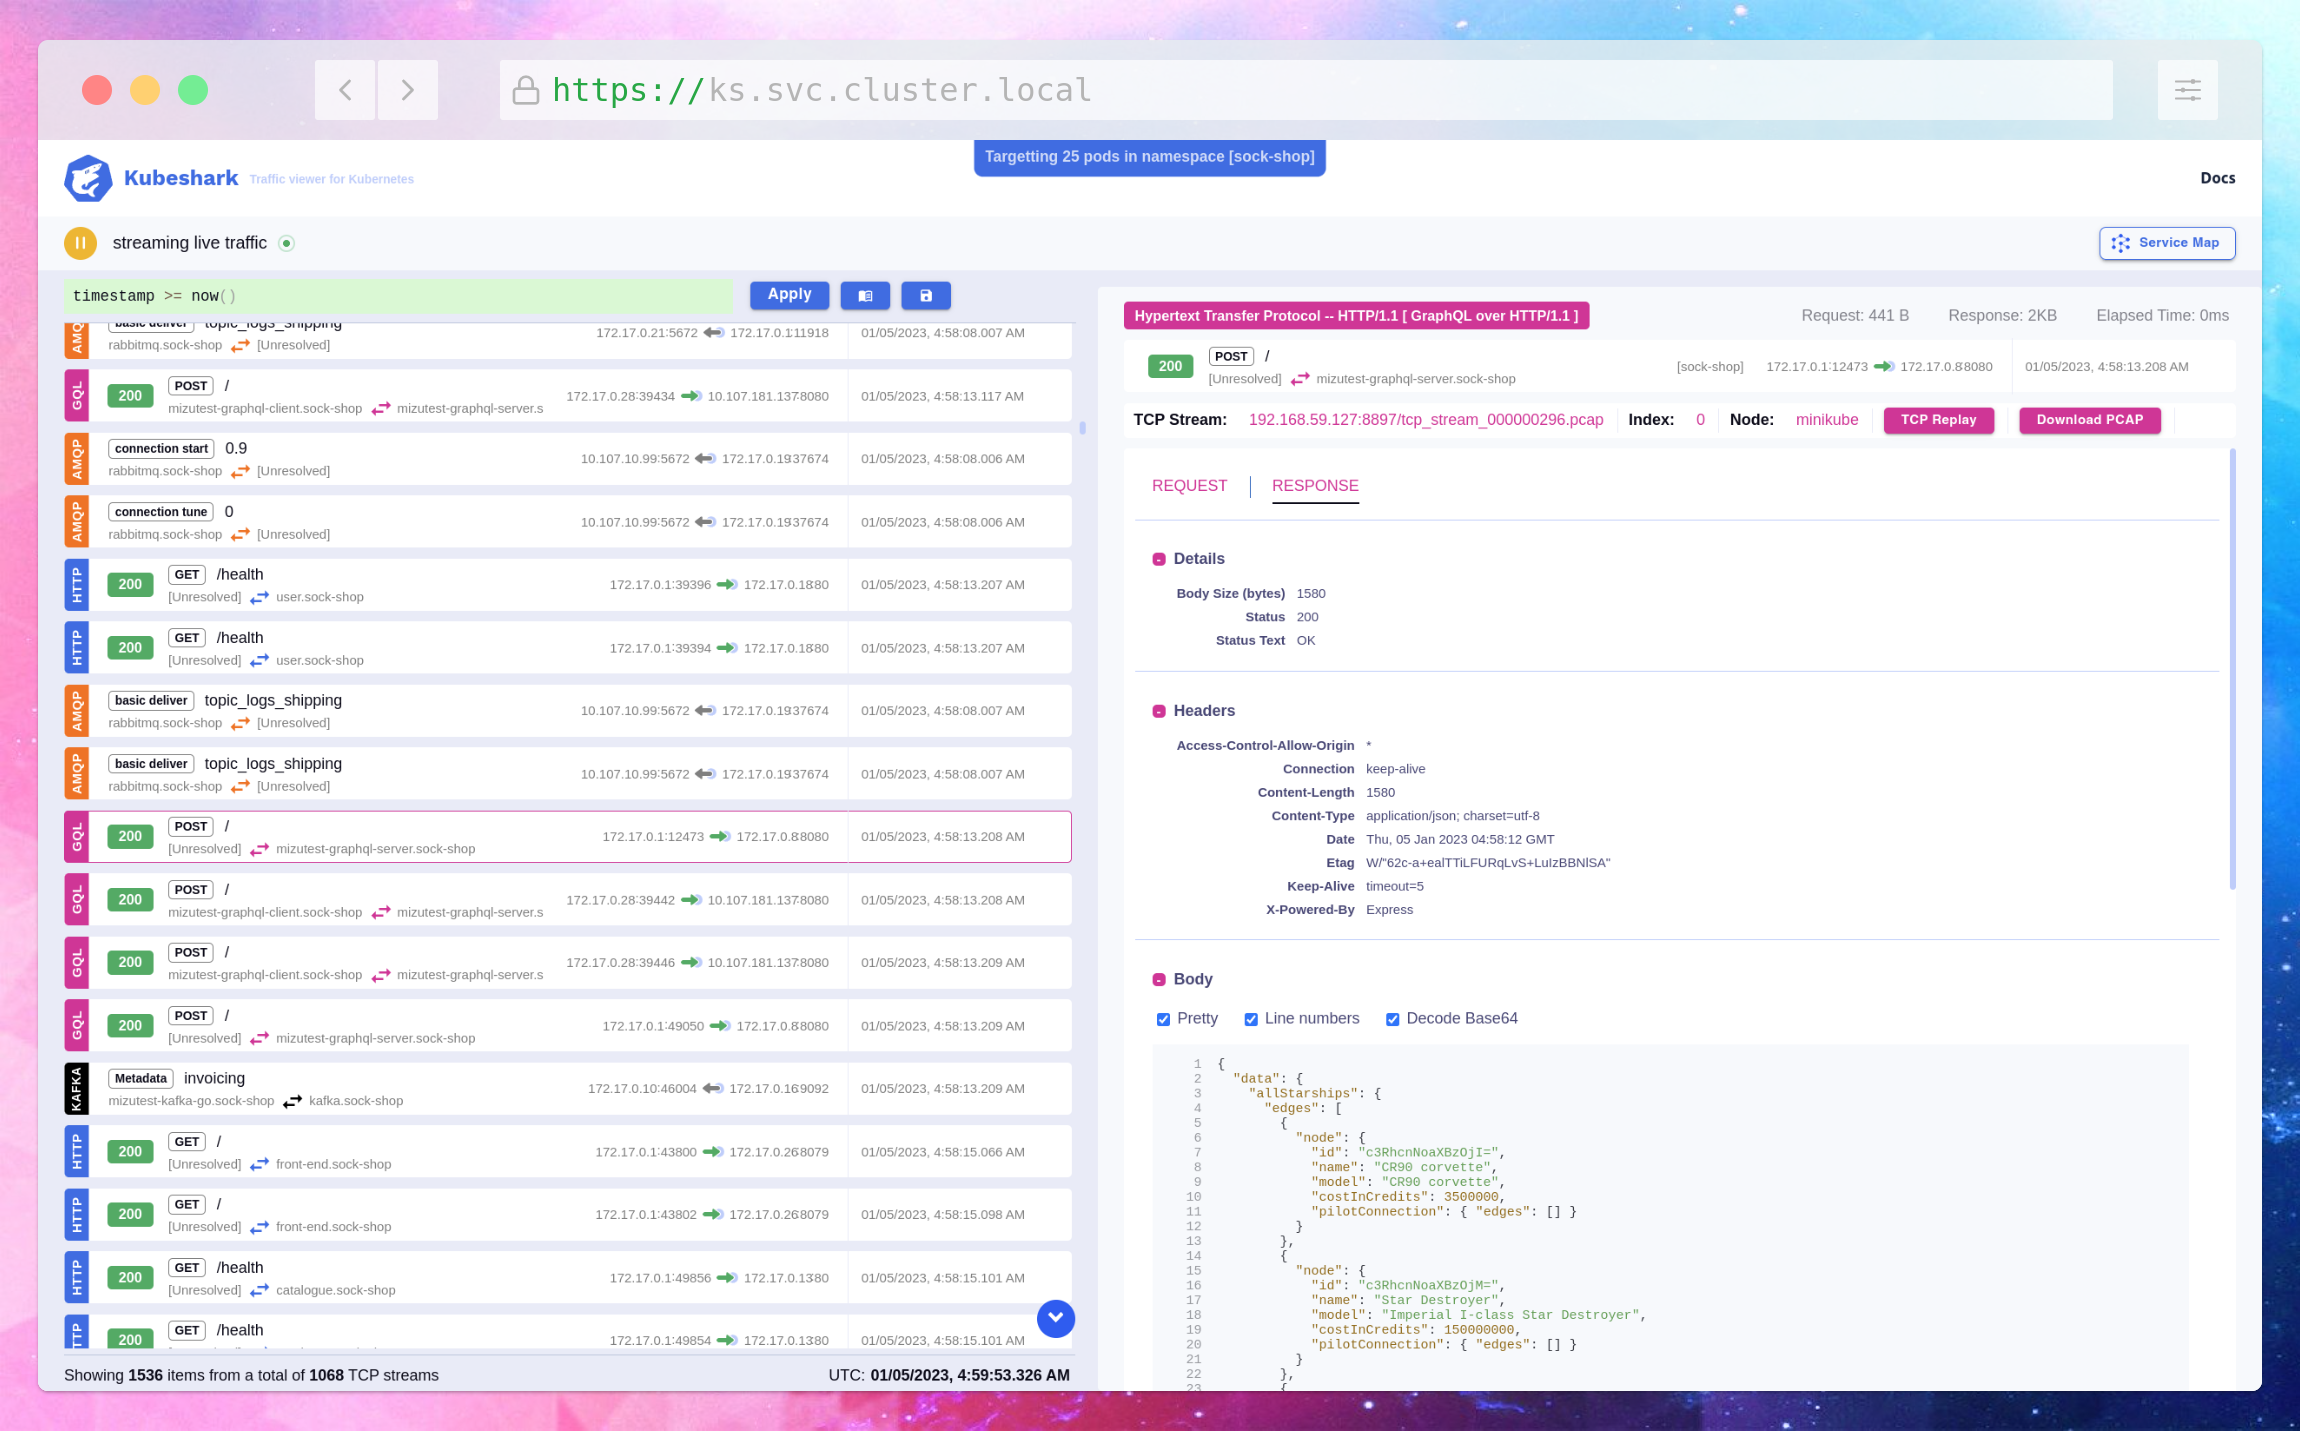
Open the dashboard
Then you should be able to see view like this
3.) deploy nginx pod using the below command.
kubectl apply -f - <<EOF
apiVersion: v1
kind: Pod
metadata:
  name: nginx
spec:
  containers:
  - name: nginx
    image: nginx
EOF
4.) Try to access "aws.com" to generate traffic flow using the below command.
kubectl exec nginx curl https://aws.com
5.) Access kubeshark using the below command.
kubectl -n kube-system port-forward svc/kubeshark-front 3000:80
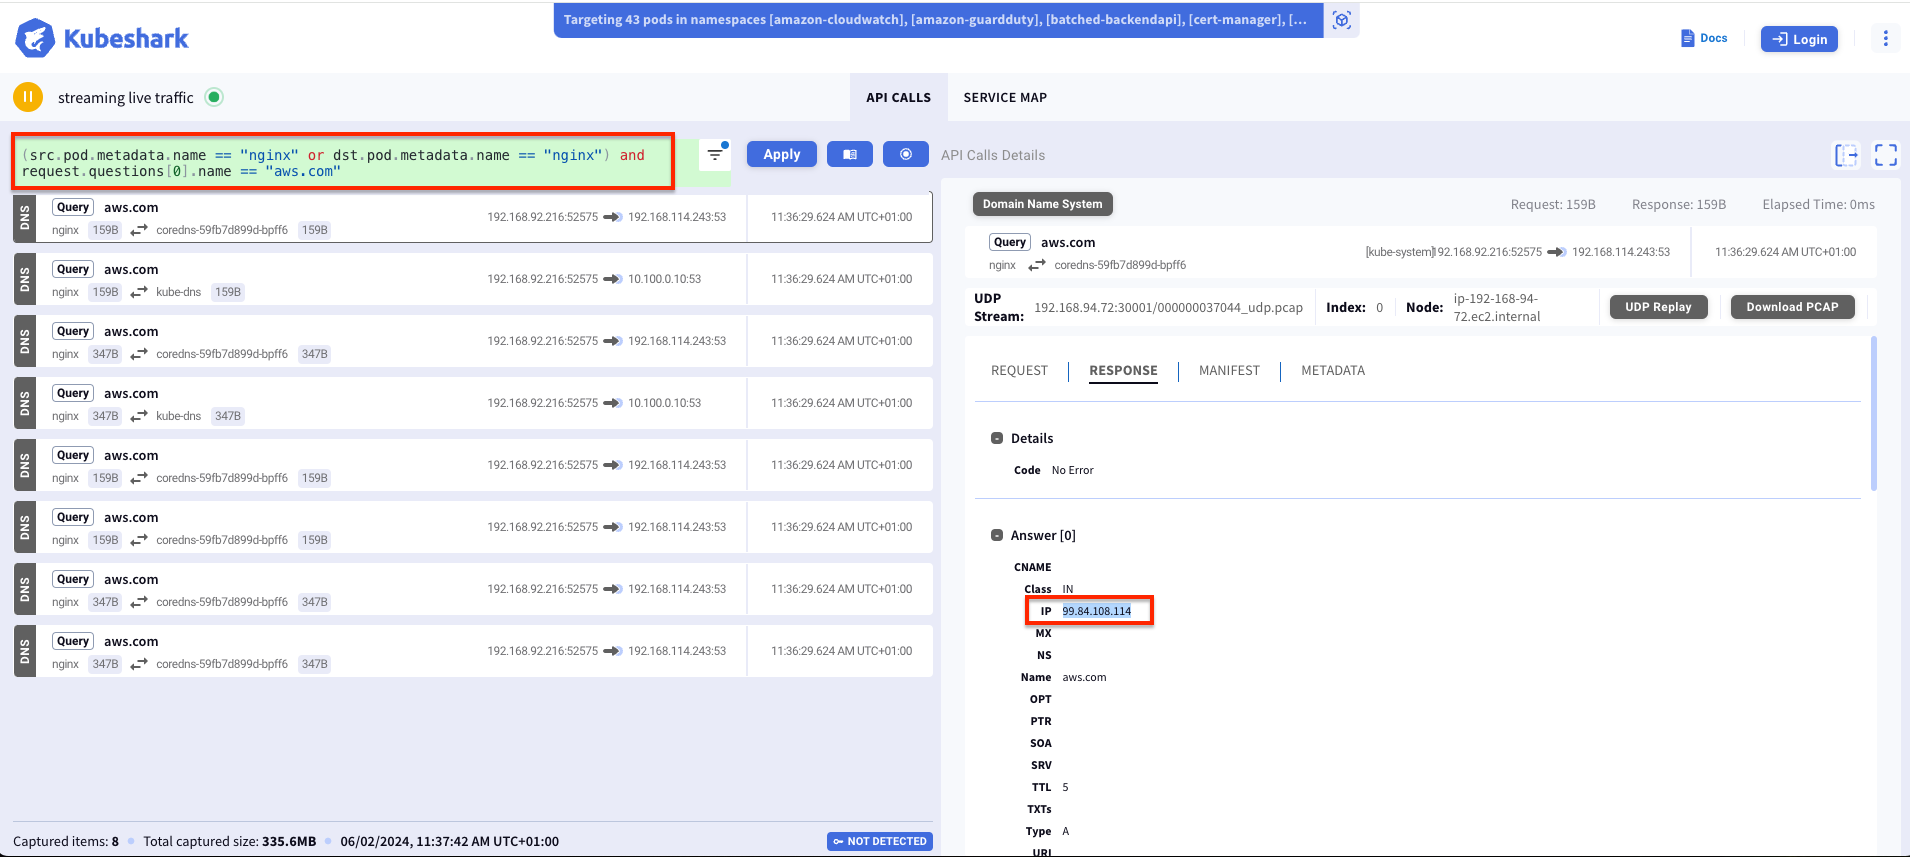
6.) Run Kubeshark query to identify the traffic flow.
(src.pod.metadata.name == "nginx" or dst.pod.metadata name == "nginx") and request.questions[0].name == "aws.com" or (src.name == "nginx" and src.namespace == "default" and dst.name == "kube-dns" and dst.namespace == "kube-system")
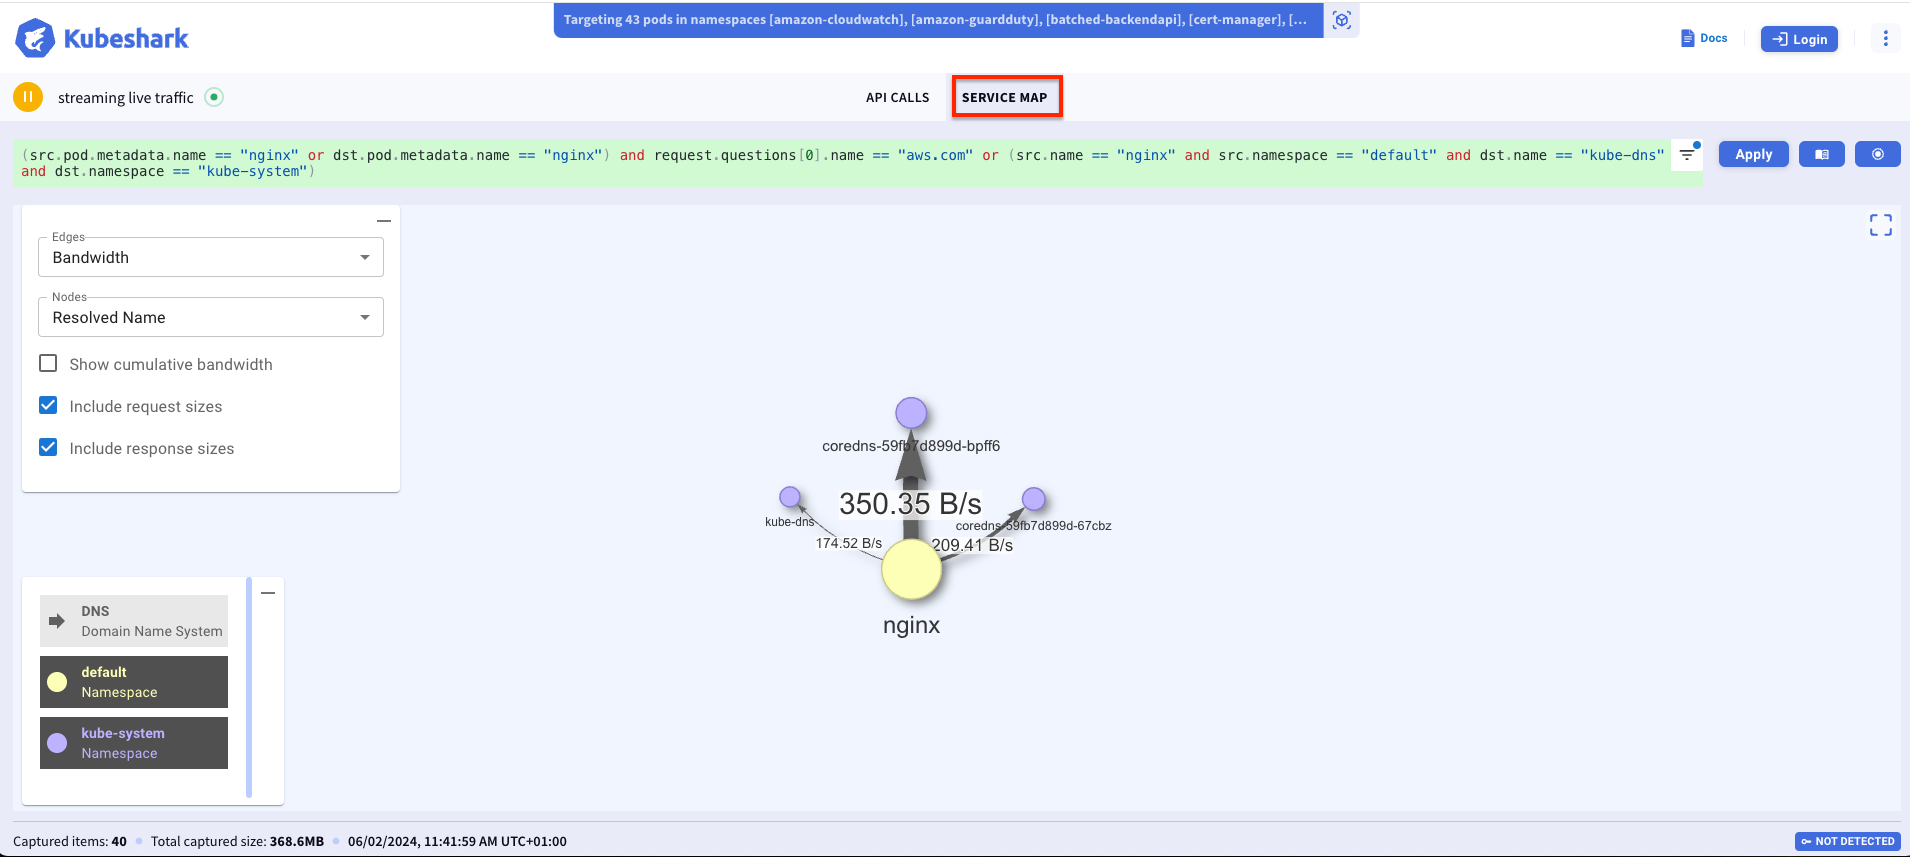
Also you can visualize the traffic flow and bandwidth using service map feature as shown below.
Cleanup¤
To clean up your EKS Blueprints, run the following commands:
make pattern kubeshark destroy
Disclaimer¤
This pattern relies on an open source NPM package aws-eks-blueprint-addon. Please refer to the package npm site for more information.
https://www.npmjs.com/package/kubeshark'
If you have any questions about the npm package or find any defect, please post in the source repo at: https://github.com/zghanem0/kubeshark/issues