OSS Apiserver Monitoring
Objective¤
This pattern demonstrates how to use the New EKS Cluster Open Source Observability Accelerator with API Server monitoring.
Prerequisites¤
Ensure that you have installed the following tools on your machine.
Deploying¤
Please follow the Deploying instructions of the New EKS Cluster Open Source Observability Accelerator pattern, except for step 7, where you need to replace "context" in ~/.cdk.json with the following:
  "context": {
    "fluxRepository": {
      "name": "grafana-dashboards",
      "namespace": "grafana-operator",
      "repository": {
        "repoUrl": "https://github.com/aws-observability/aws-observability-accelerator",
        "name": "grafana-dashboards",
        "targetRevision": "main",
        "path": "./artifacts/grafana-operator-manifests/eks/infrastructure"
      },
      "values": {
        "GRAFANA_CLUSTER_DASH_URL" : "https://raw.githubusercontent.com/aws-observability/aws-observability-accelerator/main/artifacts/grafana-dashboards/eks/infrastructure/cluster.json",
        "GRAFANA_KUBELET_DASH_URL" : "https://raw.githubusercontent.com/aws-observability/aws-observability-accelerator/main/artifacts/grafana-dashboards/eks/infrastructure/kubelet.json",
        "GRAFANA_NSWRKLDS_DASH_URL" : "https://raw.githubusercontent.com/aws-observability/aws-observability-accelerator/main/artifacts/grafana-dashboards/eks/infrastructure/namespace-workloads.json",
        "GRAFANA_NODEEXP_DASH_URL" : "https://raw.githubusercontent.com/aws-observability/aws-observability-accelerator/main/artifacts/grafana-dashboards/eks/infrastructure/nodeexporter-nodes.json",
        "GRAFANA_NODES_DASH_URL" : "https://raw.githubusercontent.com/aws-observability/aws-observability-accelerator/main/artifacts/grafana-dashboards/eks/infrastructure/nodes.json",
        "GRAFANA_WORKLOADS_DASH_URL" : "https://raw.githubusercontent.com/aws-observability/aws-observability-accelerator/main/artifacts/grafana-dashboards/eks/infrastructure/workloads.json",
        "GRAFANA_APISERVER_BASIC_DASH_URL" : "https://raw.githubusercontent.com/aws-observability/aws-observability-accelerator/main/artifacts/grafana-dashboards/eks/apiserver/apiserver-basic.json",
        "GRAFANA_APISERVER_ADVANCED_DASH_URL" : "https://raw.githubusercontent.com/aws-observability/aws-observability-accelerator/main/artifacts/grafana-dashboards/eks/apiserver/apiserver-advanced.json",
        "GRAFANA_APISERVER_TROUBLESHOOTING_DASH_URL" : "https://raw.githubusercontent.com/aws-observability/aws-observability-accelerator/main/artifacts/grafana-dashboards/eks/apiserver/apiserver-troubleshooting.json",
        "GRAFANA_KSH_DASH_URL" : "https://raw.githubusercontent.com/aws-observability/aws-observability-accelerator/main/artifacts/grafana-dashboards/eks/infrastructure/ksh.json",
        "GRAFANA_KCM_DASH_URL" : "https://raw.githubusercontent.com/aws-observability/aws-observability-accelerator/main/artifacts/grafana-dashboards/eks/infrastructure/kcm.json"
      },
      "kustomizations": [
        {
          "kustomizationPath": "./artifacts/grafana-operator-manifests/eks/infrastructure"
        },
        {
          "kustomizationPath": "./artifacts/grafana-operator-manifests/eks/apiserver"
        }
      ]
    },
    "apiserver.pattern.enabled": true,
  }
Visualization¤
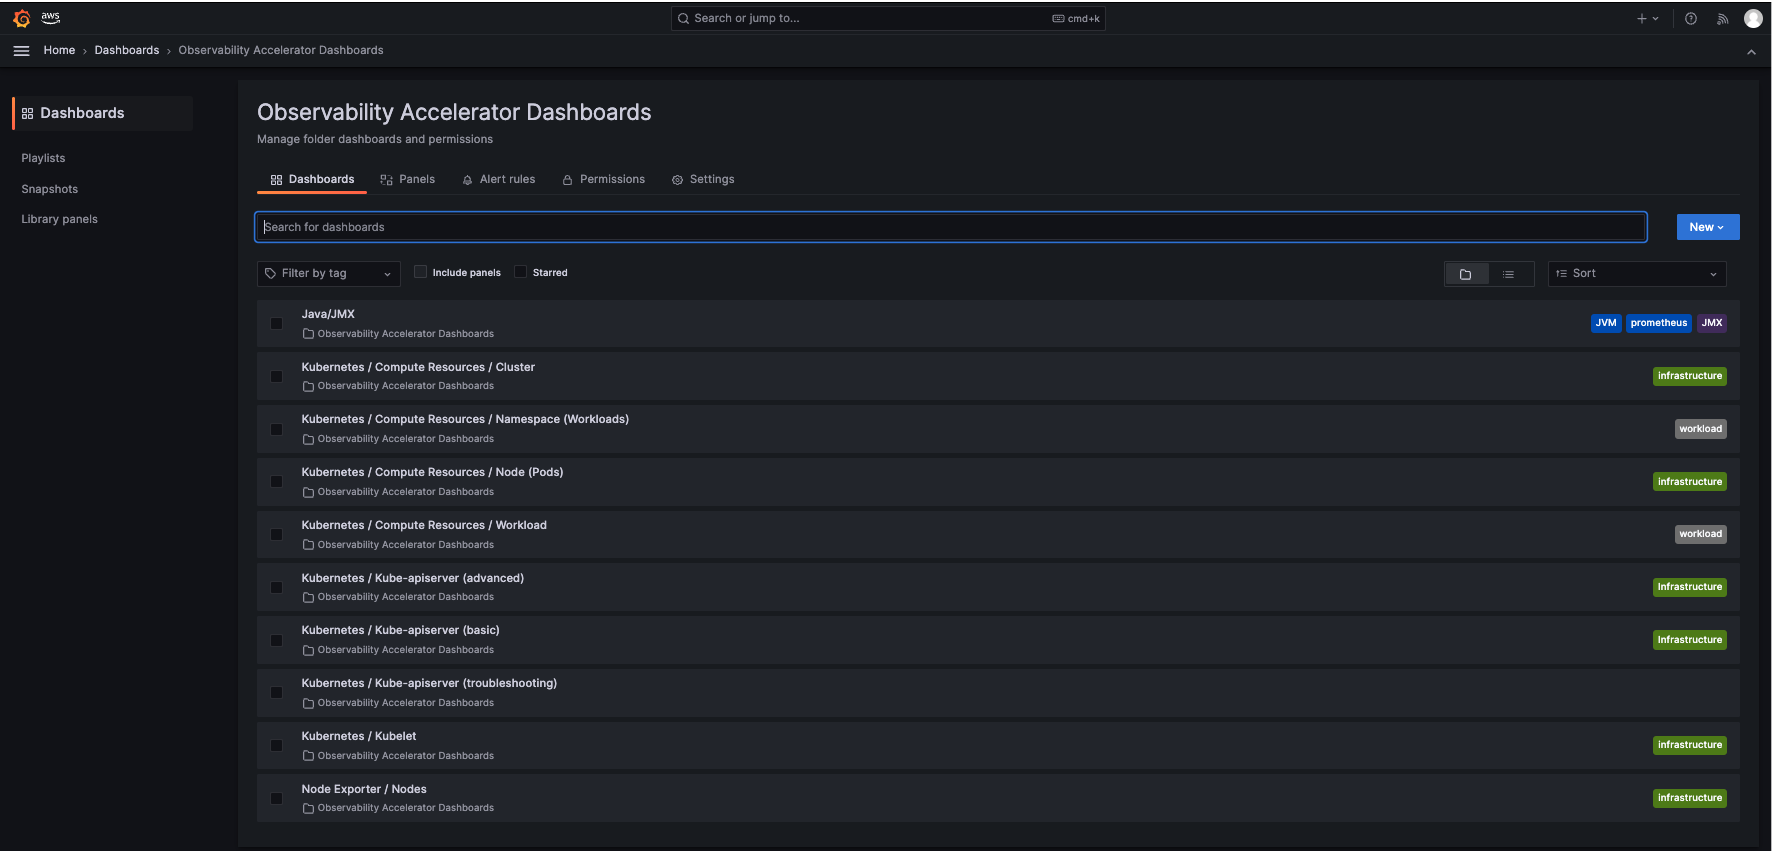
Login to your Grafana workspace and navigate to the Dashboards panel. You should see three new dashboard named Kubernetes/Kube-apiserver (basic), Kubernetes/Kube-apiserver (advanced), Kubernetes/Kube-apiserver (troubleshooting), under Observability Accelerator Dashboards:
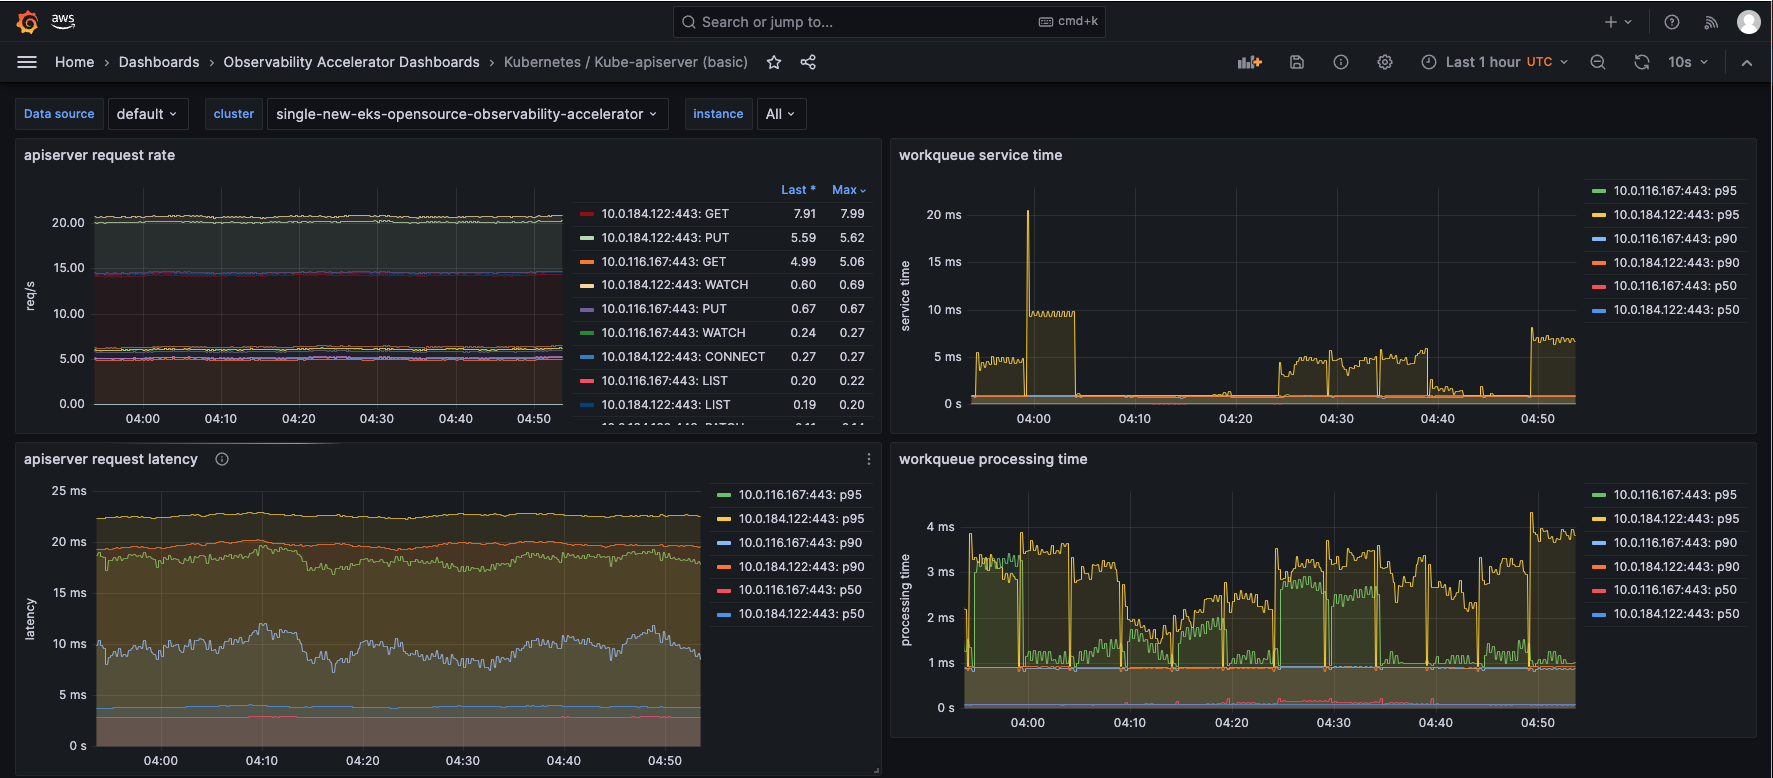
Open the Kubernetes/Kube-apiserver (basic) dashboard and you should be able to view its visualization as shown below:
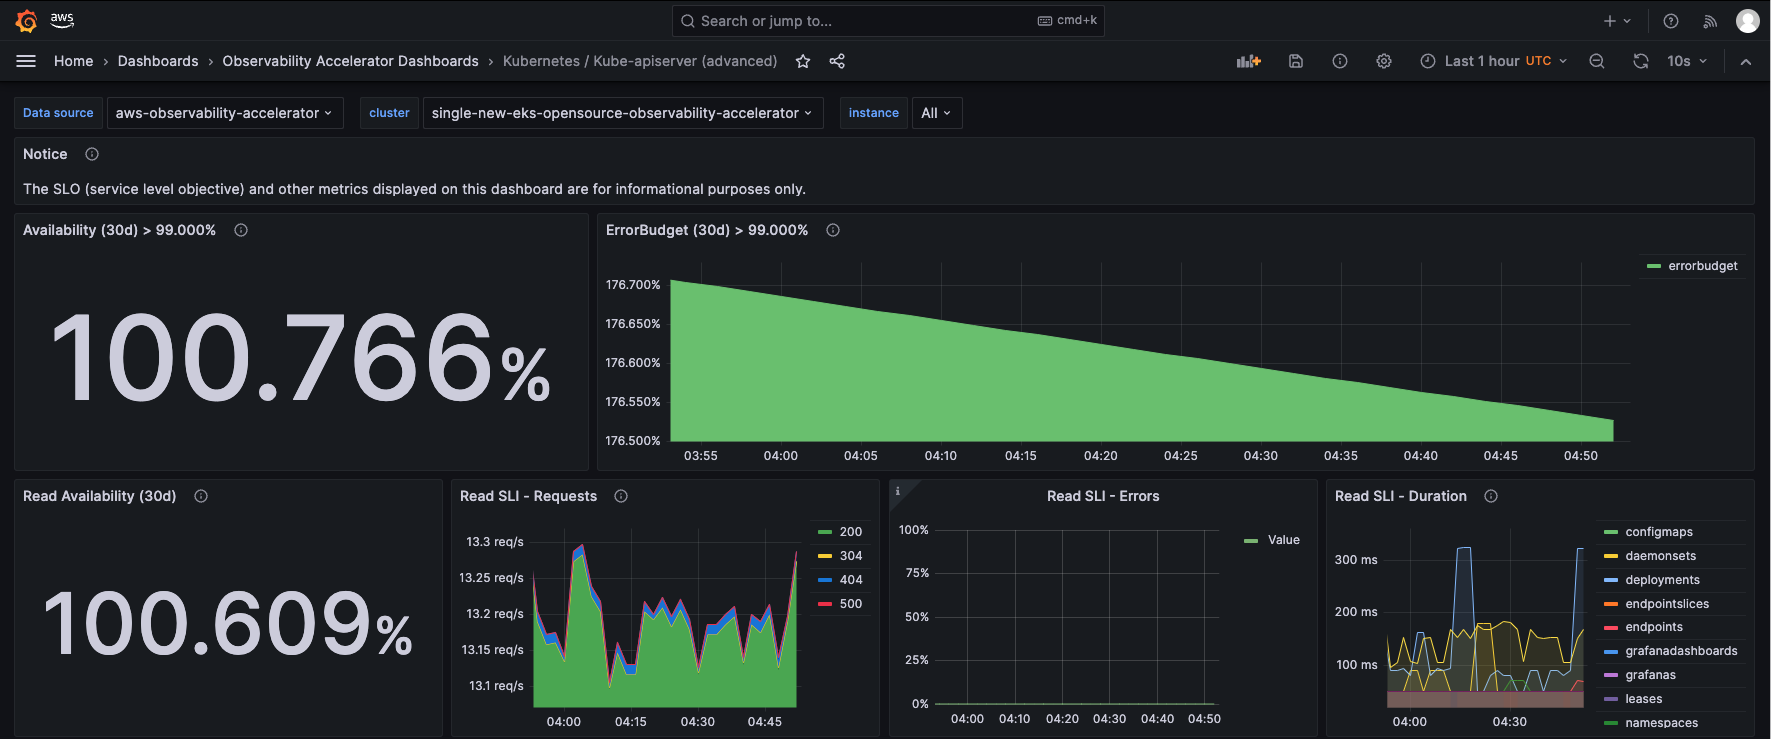
Open the Kubernetes/Kube-apiserver (advanced) dashboard and you should be able to view its visualization as shown below:
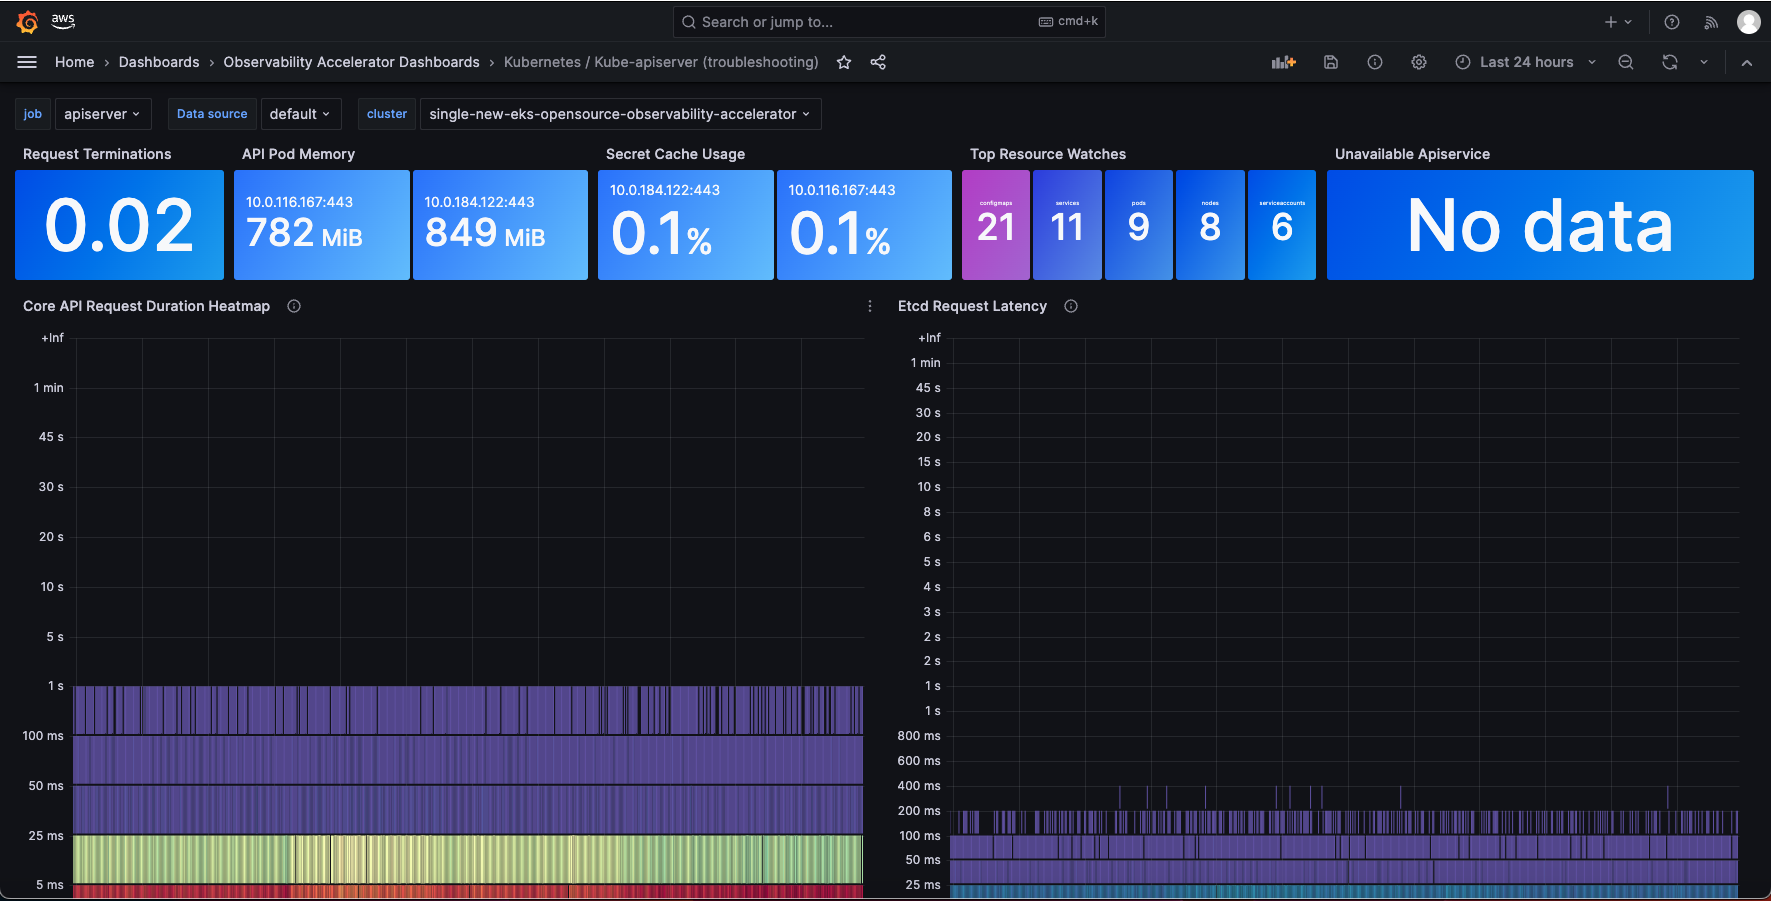
Open the Kubernetes/Kube-apiserver (troubleshooting) dashboard and you should be able to view its visualization as shown below:
Teardown¤
You can teardown the whole CDK stack with the following command:
make pattern single-new-eks-opensource-observability destroy