Data Visualization
Architecture
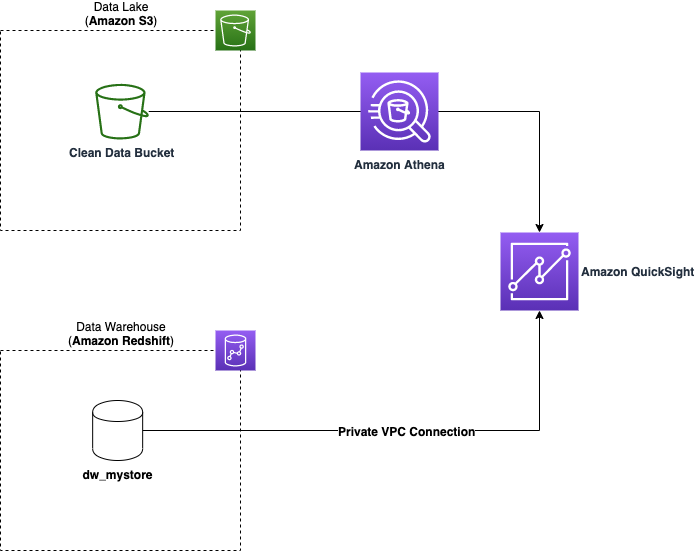
The data visualization provide a single entry point to analyze the different data sources and extract value via dashboards, reports and adhoc analysis.
It is implemented with Amazon Quicksight, a scalable, serverless, embeddable and machine learning-powered business intelligence tool. Amazon QuickSight is connected to the data lake via Amazon Athena and the data lake via Amazon Redshift using direct query mode, in opposition to the caching mode with SPICE.
Data Lake
The following steps outline the connection of Amazon QuickSight to the data lake:
- An Amazon Athena data source is used in Amazon QuickSight in order to connect to the data in the data lake.
- An Amazon QuickSight data set is created, with a direct SQL query to the clean data within the data lake - this data set can be used to create self-service analysis of the data.
- A pre-built dashboard is deployed which provides visualisation of the data lake Clean data.
Data Warehouse
The following steps outline the connection of Amazon QuickSight to the data lake:
- As the Amazon Redshift cluster is within a private subnet, a VPC connection is made from Amazon QuickSight to the VPC.
- An Amazon Redshift data source is used in Amazon QuickSight in order to connect to the data lake, using credentials for a data analyst user.
- An Amazon QuickSight data set is created, with a direct SQL query to the data lake - this data set can be used to create self-service analysis of the data.
- A pre-built dashboard is deployed which provides visualisation of the data within the data lake.