Per-sandbox limits you can see
Before you start, review the prerequisites and shared setup on the home page, and run the hello sandbox blueprint first so you have a cluster with the runtime classes. This blueprint also uses the once-per-cluster network policy enforcement that Getting started > Coding agent turns on. The commands below use files from this repository, so clone it if you have not already, and run them from this blueprint's folder:
git clone https://github.com/aws-samples/sample-eks-nitro-sandbox.git
cd sample-eks-nitro-sandbox/examples/isolation/sandbox-limits
A Nitro sandbox applies per-pod limits so no single sandboxed pod can exhaust a resource the whole node shares. Two are easy to reach by accident: a limit on how many DNS queries a second the pod may send to the cluster resolver, and a limit on how many simultaneous outbound connections the pod may hold. Both are on by default and stay invisible until a workload crosses one, at which point the symptom looks like an application bug. This blueprint makes each limit visible on your own cluster and teaches its symptom, so a team recognises it instead of debugging it blind.
Each is shown the same honest way: run the same probe twice, side by side, differing only in
runtimeClassName: isolated-sandbox versus an ordinary pod, and watch only the sandboxed pod
reach the limit while the identical ordinary pod sails past it. The ordinary pod is the control,
so the result cannot be read any other way: same image, same target, same offered load, and the
only pod that reaches the limit is the sandboxed one.
The table below lists every per-sandbox limit, so a reader who meets one this blueprint does not walk through still has its annotation, its default and how to change it. The walkthroughs then cover the DNS query-rate limit first, then the outbound connection limit.
Every per-sandbox limit and its default
Each limit below is set per pod with an annotation on the pod, or on the pod template for a
pod a controller creates. Nine of the eleven are on by default; the two root filesystem
limits ship as disabled and are unlimited already. The numbers are the Amazon EKS User
Guide's: Set up isolated and confidential pods, section "Pod annotations" and "Throttling",
lists each annotation and its default, and Isolated and confidential pods limitations
covers the connection and DNS limits and what happens to a pod that sets one to 0.
Bandwidth values are in bits per second, not bytes per second, so 100M means 100 Mbit/s.
The rest are dimensionless: packets a second, I/O operations a second, connections. All of
them are read once when the pod is created, so changing one on a running pod has no effect;
delete the pod and recreate it.
| Annotation | Default | How to turn it off |
|---|---|---|
sandbox.amazonaws.com/ingress-bandwidth |
100M, inbound network bandwidth (100 Mbit/s) |
Set it to "disabled" |
sandbox.amazonaws.com/egress-bandwidth |
100M, outbound network bandwidth (100 Mbit/s) |
Set it to "disabled" |
sandbox.amazonaws.com/ingress-packets-per-second |
1500, inbound packet rate |
Set it to "disabled" |
sandbox.amazonaws.com/egress-packets-per-second |
1500, outbound packet rate |
Set it to "disabled" |
sandbox.amazonaws.com/dns-packets-per-second |
100, DNS queries a second to the resolver, per address family. Values above 512 are clamped down to 512 |
Set it to "disabled" |
sandbox.amazonaws.com/overlay-disk-bandwidth |
400M, throughput of the overlay (ephemeral scratch) disk (400 Mbit/s, equivalent to 50 MiB/s) |
Set it to "disabled" |
sandbox.amazonaws.com/overlay-disk-iops |
1500, overlay disk I/O operations a second |
Set it to "disabled" |
sandbox.amazonaws.com/rootfs-disk-bandwidth |
disabled, root filesystem throughput |
Already off: unlimited by default, because the root filesystem is read-only and needed for boot |
sandbox.amazonaws.com/rootfs-disk-iops |
disabled, root filesystem I/O operations a second |
Already off: unlimited by default |
sandbox.amazonaws.com/log-bandwidth |
2M, container log streaming throughput (2 Mbit/s, equivalent to 256 KiB/s) |
Set it to "disabled" |
sandbox.amazonaws.com/conntrack-limit |
4096, connections the pod may hold in the node's connection-tracking table, per address family |
Cannot be turned off. Both "0" and "disabled" are refused and the pod fails to start. It can only be raised, and a value is clamped into 64 to 65536 |
Check this table before you call it an application bug
A workload that showed no problem as an ordinary pod and shows one as a sandboxed pod may
be meeting one of these defaults rather than a bug of its own: dropped or timed-out new
connections, intermittent DNS failures, network throughput that will not climb past about
100 Mbit/s, slow scratch-disk I/O, or container logs that arrive truncated or late. Every
default in the table except the two root filesystem limits is a finite value, and
"disabled" turns every one of them off for a pod except
sandbox.amazonaws.com/conntrack-limit, which cannot be turned off and can only be
raised within 64 to 65536.
"0" is never the way to turn a limit off. Any value that works out to a rate of zero
(0, 00, 0k, 0.4, or under 8 bits per second for a bandwidth annotation) fails the
pod, which stays in Pending or ContainerCreating with repeated FailedCreatePodSandBox
events instead of reaching Failed, because the kubelet retries sandbox creation
indefinitely. kubectl describe pod <name> and its events name the annotation that was
refused.
Two more things the User Guide notes are easy to get wrong. Network bandwidth and packet rate
are enforced by independent token buckets, so raising egress-bandwidth without also raising
egress-packets-per-second leaves throughput capped near 100 Mbit/s: at the default 1500
packets a second and the 9001-byte MTU EKS nodes typically use, 1500 x 9001 is about
102 Mbit/s, which is what the bandwidth default already allows. And an unrecognised value,
such as 100MB or 100 M, is logged and replaced with the built-in default, so a typo leaves
the throttle where it was rather than failing the pod.
sandbox.amazonaws.com/network-isolated is deliberately not in this table. It is a
connectivity toggle rather than a throttle: it is off unless you set it to "true", and when
you do the sandbox boots with no network interface at all, rather than a capped one, so it has
no default to raise and nothing to turn off. The
hello sandbox blueprint shows that mode.
The two limits this blueprint walks through are the
DNS query rate (dns-packets-per-second) and the
outbound connection count (conntrack-limit), each measured
on your own cluster against an identical ordinary pod.
The DNS query-rate limit
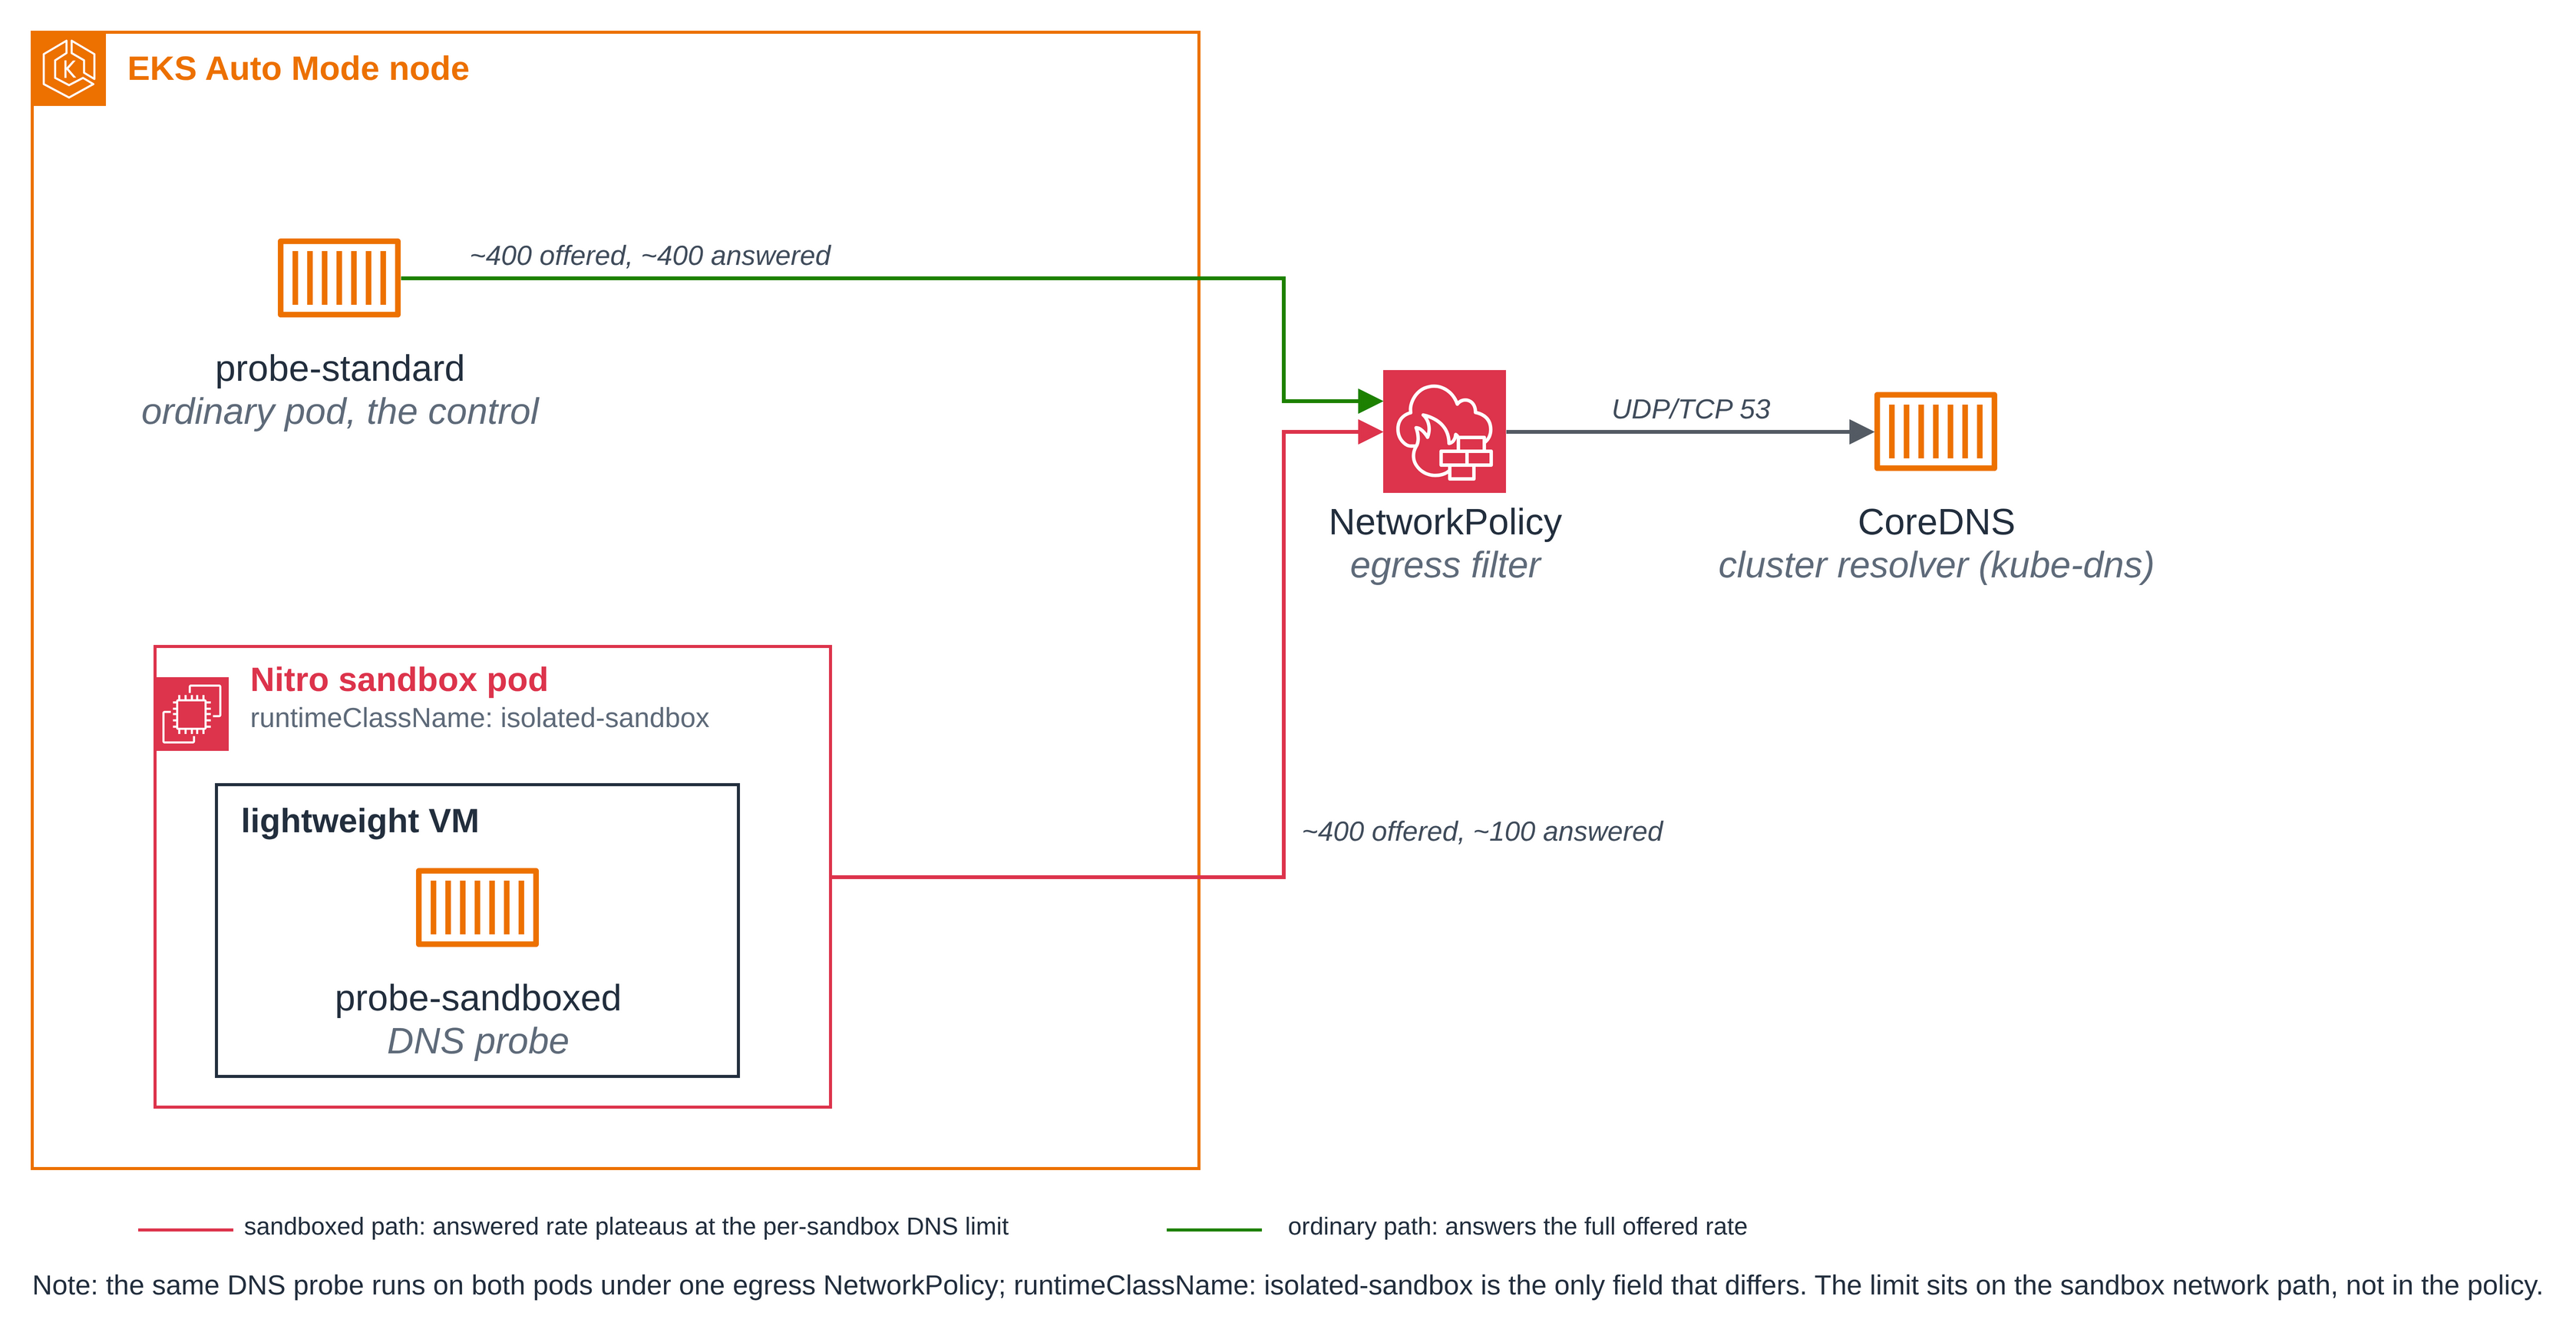
A Nitro sandbox applies a per-pod limit on how many DNS queries a second the pod may send to the cluster resolver. It is on by default and stays invisible until a workload crosses it, at which point a fraction of lookups simply go unanswered. That reads as intermittent resolution timeouts, which looks like a flaky application or a slow resolver rather than a limit doing its job.
It runs the same DNS probe twice, side by side, differing only in
runtimeClassName: isolated-sandbox versus an ordinary pod. Below the limit both answer every
query. Above it, the sandboxed pod's answered throughput plateaus near the documented limit
while the identical ordinary pod keeps answering the full offered rate. The ordinary pod is the
control, so the result cannot be read any other way: same image, same resolver, same offered
load, and the only pod that plateaus is the sandboxed one.
- A limit you can measure. The sandboxed probe raises its offered DNS rate past the limit and its answered rate stops climbing, while the ordinary probe answers everything it offers.
- The ordinary pod is the control that makes the result mean something. If the resolver or the offered burst were the bottleneck, the ordinary pod would plateau too. It does not, so the cause is the sandbox path.
- It sits on the sandbox network path, not in the network policy. The probe pods carry an egress policy that allows only DNS to CoreDNS; the policy scopes where the pod may connect and does not change the query-rate limit being measured.
- It opts in with one line.
runtimeClassName: isolated-sandboxis the only spec field that differs between the two probes.
Figure 1: The same DNS probe on two pods under one egress NetworkPolicy. probe-sandboxed runs
in a Nitro sandbox, a lightweight VM with its own kernel; probe-standard is an ordinary pod. Both offer the same
DNS rate to CoreDNS through the policy; the ordinary pod answers the full rate while the
sandboxed pod's answered rate plateaus at the per-sandbox DNS limit.
The files:
| File | What it is |
|---|---|
deploy/namespace.yaml |
The sandbox-limits namespace this blueprint owns |
deploy/probe-standard.yaml |
The ordinary probe pod: the control |
deploy/probe-sandboxed.yaml |
The sandboxed probe pod: identical but for runtimeClassName: isolated-sandbox |
deploy/probe-sandboxed-raised.yaml |
The optional DNS variant: a sandboxed probe with the DNS limit raised by annotation |
deploy/sink.yaml |
The connection sink: an ordinary pod that accepts and holds every inbound TCP connection open, for the connection-limit probe |
deploy/probe-sandboxed-conntrack-raised.yaml |
The optional connection variant: a sandboxed probe with the connection limit raised by annotation |
deploy/egress-policy.yaml |
The egress NetworkPolicy that selects every probe pod and allows DNS to CoreDNS and TCP to the sink |
scripts/probe-dns-rate.py |
The DNS probe: offers a fixed query rate for a fixed window and reports how many were answered |
scripts/probe-conntrack.py |
The connection probe: opens held-open outbound TCP flows to the sink by raw IP and reports the plateau |
scripts/run-comparison.sh |
The DNS comparison: runs the below-limit, control and symptom probes, prints a verdict |
scripts/run-conntrack-comparison.sh |
The connection comparison: runs the control and symptom probes against the sink, prints a verdict |
scripts/show-sandbox.sh |
Shows the sandboxed probe running in a sandbox, next to the ordinary probe |
You can run each walkthrough with its script,
scripts/run-comparison.sh for DNS and
scripts/run-conntrack-comparison.sh for the connection
limit, each of which prints a verdict. The steps below are what they do, so you can follow each
one and read its output.
The DNS limit, and where the number comes from
The Amazon EKS User Guide documents this limit in Isolated and confidential pods limitations,
section "Per-pod DNS query rate limit": each pod that uses the isolated-sandbox runtime class
has a DNS query-rate limit to the cluster resolver, with a short burst allowance, and excess
queries are dropped. The default is 100 queries per second per family. It protects the
per-ENI VPC resolver budget shared by pods on the same ENI. The guide names the same symptom
this blueprint shows: workloads that resolve a large number of unique hostnames per second "hit the
limit and see intermittent DNS resolution failures."
This page shows the measured plateau from a fresh run and that it sits near that documented 100 queries per second; the number itself is the User Guide's, not this blueprint's. The short burst allowance the guide notes is why the measured plateau reads a little above 100 over a short window.
Versions
Nothing is pinned beyond the image in the manifests: the probe pods use a stock image, pinned by
tag, and the blueprint installs no controller, SDK, client library or chart of its own. Network
policy enforcement is a cluster feature turned on with the amazon-vpc-cni ConfigMap (step 1).
| Component | Pin | Latest (2026-10-18) |
|---|---|---|
Probe image (python) |
public.ecr.aws/docker/library/python:3.12-slim |
3.12-slim |
Step 1: Turn on network policy enforcement. EKS Auto Mode accepts network policies without
enforcing them until the Network Policy Controller is enabled, once per cluster, through the
amazon-vpc-cni ConfigMap in kube-system. This affects the whole cluster; pods that no policy
selects are unaffected. If you have run the
coding agent blueprint this is already on;
otherwise:
kubectl get configmap -n kube-system amazon-vpc-cni \
  -o jsonpath='{.data.enable-network-policy-controller}{"\n"}'
If that prints true, enforcement is on. If it prints nothing, turn it on, once per cluster
(EKS network policy documentation):
kubectl patch configmap -n kube-system amazon-vpc-cni --type merge \
  -p '{"data":{"enable-network-policy-controller":"true"}}'
The comparison script checks this setting rather than changing this shared setting for you.
Step 2: Deploy the namespace, the egress policy and the two probe pods. The probe pods are
identical but for one line: probe-sandboxed sets runtimeClassName: isolated-sandbox,
probe-standard does not. The egress policy selects both and allows DNS on port 53 to any
address: it is a literal 0.0.0.0/0 in the file, so there is no cluster-specific address to
look up or substitute.
kubectl create refuses a sandbox-limits namespace that already exists, so a namespace this
blueprint did not make is never relabeled as its own:
kubectl create -f deploy/namespace.yaml &&
kubectl apply -f deploy/egress-policy.yaml &&
kubectl apply -f deploy/probe-standard.yaml &&
kubectl apply -f deploy/probe-sandboxed.yaml &&
for p in probe-standard probe-sandboxed; do
  kubectl -n sandbox-limits wait pod/$p --for=condition=Ready --timeout=300s
done
Here are the two probe specs side by side. Every field the measurement could depend on is the same; the highlighted line is the only difference.
# probe-standard.yaml                        # probe-sandboxed.yaml
apiVersion: v1                              apiVersion: v1
kind: Pod                                   kind: Pod
metadata:                                   metadata:
  name: probe-standard                        name: probe-sandboxed
  namespace: sandbox-limits                   namespace: sandbox-limits
  labels:                                     labels:
    app: dns-probe                              app: dns-probe
spec:                                       spec:
                                              runtimeClassName: isolated-sandbox   # <-- only this
  containers:                                 containers:
    - name: probe                               - name: probe
      image: .../python:3.12-slim                 image: .../python:3.12-slim
The first sandboxed pod on a new cluster waits for Auto Mode to launch a sandbox-capable node; after that a new one is Ready in about 5 to 6 seconds.
Step 3: Below the limit, the sandboxed pod answers every query. The probe offers a fixed DNS
rate to the pod's own resolver for a fixed window and counts how many are answered. Run it below
the limit first, so you have the same probe with the limit not yet reached. It is driven from the
operator side with kubectl exec -i ... -- python3 -, so there is nothing to build or copy into
the pod:
kubectl -n sandbox-limits exec -i probe-sandboxed -- env OFFERED_QPS=50 python3 - \
  < scripts/probe-dns-rate.py
offered~50qps window=5.0s drain=1.0s nameserver=10.100.0.10 qname=kubernetes.default.svc.cluster.local
sent=250 answered=250 elapsed=6.48s answered_rate=50.0qps (over the 5.0s offer window)
RESULT offered=250 answered=250 elapsed=6.48 rate=50.0
At 50 queries a second, below the limit, the sandboxed pod answers all 250 of them: 50 answered a second.
Step 4: Above the limit, only the sandboxed pod plateaus. Offer a high rate, well above the limit, first on the ordinary control and then on the sandboxed pod:
echo "control  (probe-standard)  @ 400 qps:"
kubectl -n sandbox-limits exec -i probe-standard  -- env OFFERED_QPS=400 python3 - < scripts/probe-dns-rate.py
echo "symptom  (probe-sandboxed) @ 400 qps:"
kubectl -n sandbox-limits exec -i probe-sandboxed -- env OFFERED_QPS=400 python3 - < scripts/probe-dns-rate.py
control  (probe-standard)  @ 400 qps:
offered~400qps window=5.0s drain=1.0s nameserver=10.100.0.10 qname=kubernetes.default.svc.cluster.local
sent=2000 answered=2000 elapsed=6.50s answered_rate=400.0qps (over the 5.0s offer window)
RESULT offered=2000 answered=2000 elapsed=6.50 rate=400.0
symptom  (probe-sandboxed) @ 400 qps:
offered~400qps window=5.0s drain=1.0s nameserver=10.100.0.10 qname=kubernetes.default.svc.cluster.local
sent=2000 answered=599 elapsed=6.49s answered_rate=119.8qps (over the 5.0s offer window)
RESULT offered=2000 answered=599 elapsed=6.49 rate=119.8
Offered the same 400 queries a second, the ordinary pod answers all 2000 (400 a second) while the sandboxed pod answers 599 of them, plateauing at 119.8 a second. That plateau is near the documented 100 queries per second per family (the extra reflects the burst allowance the User Guide notes over this short window). The ordinary pod answering the full rate against the same resolver rules out the cluster DNS and the offered burst as the cause, so the plateau is the per-sandbox limit on the sandbox path.
The whole comparison, with its verdict, is one command:
scripts/run-comparison.sh
=== Results ===
sandbox  @ 50 qps (below the limit)        50.0 qps answered
standard @ 400 qps (control)               400.0 qps answered
sandbox  @ 400 qps (symptom)               119.8 qps answered

=== Verdict ===
RESULT: the per-sandbox DNS query-rate limit bites on the sandbox path and not on the
ordinary path. Below the limit the sandboxed probe answered 50.0 qps; at 400
qps offered it plateaued at 119.8 qps while the ordinary control answered 400.0
qps. The measured plateau is near the documented 100 qps per family (EKS User Guide).
The block is abridged: it starts at === Results ===. Before that the script creates the
namespace, applies the policy and the two pods, and prints each probe's answered rate.
How the network policy works
The probe pods have a network, so the blueprint restricts their egress with a standard
networking.k8s.io/v1 NetworkPolicy and shows the whole policy here. It allows just two things,
the DNS the DNS probe needs and the TCP egress to the sink the connection probe needs, and denies
everything else. DNS (port 53) is allowed to any IP address: a literal 0.0.0.0/0 in the file,
with no cluster-specific address to look up or substitute. While CoreDNS typically runs on a
fixed cluster address, allowing any destination eliminates the need for address lookup and
substitution and avoids issues with missing or malformed cluster DNS addresses.
apiVersion: networking.k8s.io/v1
kind: NetworkPolicy
metadata:
  name: dns-probe-egress
  namespace: sandbox-limits
spec:
  podSelector:
    matchLabels:
      app: dns-probe
  policyTypes:
    - Ingress
    - Egress
  egress:
    - to:
        - ipBlock: { cidr: 0.0.0.0/0 }
      ports:
        - { protocol: UDP, port: 53 }
        - { protocol: TCP, port: 53 }
    - to:
        - podSelector:
            matchLabels:
              app: conntrack-sink
      ports:
        - { protocol: TCP, port: 9000 }
| Part | What it does |
|---|---|
podSelector: app: dns-probe |
Selects every probe pod, the sandboxed and the ordinary one alike |
policyTypes: [Ingress, Egress] |
Makes both directions default-deny for the selected pods, so anything not allowed below is refused |
no ingress: rule |
Denies all ingress to the probe pods |
egress to 0.0.0.0/0 on UDP and TCP 53 |
DNS to any address, which the DNS probe needs. An ipBlock, as Getting started > Coding agent uses |
egress to the conntrack-sink pod on TCP 9000 |
The connection sink, which the connection-limit probe opens held-open outbound flows to. Nothing else is reachable, so the probe cannot leave the cluster |
The policy is enforced on the node, outside the guest: the node's network policy agent attaches the enforcement to the pod's host-side interface, so a command run inside the sandbox, even as root, is subject to it. Its limit: DNS is open on port 53 to any address, so a resolver is always reachable; everything beyond DNS and the conntrack sink is denied. A pod can always reach its own node.
Apply the policy and wait for its PolicyEndpoint before relying on enforcement: it shows the
controller has handed the policy to the nodes. The PolicyEndpoint name ends in a random suffix,
so yours will differ:
kubectl -n sandbox-limits get networkpolicies,policyendpoints
NAME                                               POD-SELECTOR    AGE
networkpolicy.networking.k8s.io/dns-probe-egress   app=dns-probe   22m

NAME                                                       AGE
policyendpoint.networking.k8s.aws/dns-probe-egress-t75lm   22m
Show it working, one allowed and one refused. DNS on port 53 is allowed; the same resolver address on port 80, which no rule allows, is refused and the connection runs to a timeout -- the policy scopes a port, not an address:
# allowed: a DNS query on port 53 is answered
kubectl -n sandbox-limits exec -i probe-sandboxed -- env OFFERED_QPS=50 WINDOW=1 python3 - \
  < scripts/probe-dns-rate.py | tail -1
# refused: a TCP connection to the same resolver on port 80 (no rule allows it) times out
NAMESERVER=$(kubectl -n sandbox-limits exec probe-sandboxed -- sed -n 's/^nameserver //p' /etc/resolv.conf | head -1)
kubectl -n sandbox-limits exec probe-sandboxed -- python3 -c \
  "import socket; s=socket.socket(); s.settimeout(6)
try: s.connect(('$NAMESERVER',80)); print('reached')
except Exception as e: print('refused:', type(e).__name__)"
RESULT offered=50 answered=50 elapsed=2.48 rate=50.0
refused: TimeoutError
The query-rate limit sits on the sandbox network path, not in this policy: the policy only scopes which destinations the probe may reach. Keeping egress to the in-cluster resolver also means the blueprint needs no internet egress.
Optional: raise the DNS limit and watch the plateau move
The User Guide documents a per-pod annotation that sets the limit,
sandbox.amazonaws.com/dns-packets-per-second (values above 512 are clamped to 512, "disabled"
turns the throttle off). deploy/probe-sandboxed-raised.yaml
is probe-sandboxed with that annotation set to 300:
metadata:
  name: probe-sandboxed-raised
  annotations:
    sandbox.amazonaws.com/dns-packets-per-second: "300"
spec:
  runtimeClassName: isolated-sandbox
Run the comparison with the raised variant added:
scripts/run-comparison.sh --raised
=== Results ===
sandbox  @ 50 qps (below the limit)        50.0 qps answered
standard @ 400 qps (control)               400.0 qps answered
sandbox  @ 400 qps (symptom)               119.8 qps answered
sandbox  @ 400 qps, limit raised 300       319.8 qps answered

=== Verdict ===
RESULT: the per-sandbox DNS query-rate limit bites on the sandbox path and not on the
ordinary path. Below the limit the sandboxed probe answered 50.0 qps; at 400
qps offered it plateaued at 119.8 qps while the ordinary control answered 400.0
qps. The measured plateau is near the documented 100 qps per family (EKS User Guide).
With the limit raised to 300, the plateau moved to 319.8 qps: direct evidence the plateau is that limit.
Abridged as above: the block starts at === Results ===.
With the annotation at 300, the plateau moves from about 100 to about 300 (again a little above, by the same burst allowance), while the default-limit pod still plateaus near 100. The plateau tracks the configured limit, which is direct evidence that the plateau is this limit and not some other bottleneck.
Recognising the DNS limit
When a sandboxed pod shows intermittent DNS resolution timeouts, this is the two-minute check before chasing it as an application bug:
- The shape: a sandboxed pod (
runtimeClassName: isolated-sandbox) doing many DNS lookups a second, with a fraction of lookups timing out while the rest resolve fine. It reads as a flaky resolver or a slow network, but established lookups are healthy and only the rate is the problem. - The fix is DNS-side, not application-side: cache lookups, pool and reuse connections so each
request does not do a fresh lookup, or resolve a name once and reuse the address. The User
Guide suggests adding a DNS cache to the pod (for example
dnsmasq, or CoreDNS as a cache container) so repeated lookups do not each generate an outbound query. - Raising the limit is an option only because the User Guide documents the
sandbox.amazonaws.com/dns-packets-per-secondannotation for it, as the optional variant above shows. Where a limit is fixed, the fix is to design under it.
Reading the DNS result
The ordinary control is what makes this a result rather than a coincidence. It runs the same probe on the node's normal path, so the two high-rate readings together classify any outcome, and this page reads them this way:
| ordinary pod | sandboxed pod | Meaning |
|---|---|---|
| answers the full rate | plateaus | The per-sandbox DNS limit bites on the sandbox path, as this blueprint claims. |
| answers the full rate | also answers the full rate | The limit did not show on this cluster under this load, so the build is not enforcing it here. That is a runtime fact, not a sandbox defect, and the page states no number in that case. |
| plateaus | either | The cluster DNS or the offered load is the bottleneck, not the sandbox. The result cannot be attributed, so the comparison says so rather than blaming the sandbox. |
The comparison script applies exactly this reading and refuses to report a limit unless the control answered the full rate and only the sandboxed pod plateaued.
The outbound connection limit
A Nitro sandbox also applies a per-pod limit on how many simultaneous outbound connections the pod may hold. It has the same side-by-side shape as the DNS limit: the same probe runs on the sandboxed pod and an identical ordinary pod, and only the sandboxed one reaches the limit.
The Amazon EKS User Guide documents it in Isolated and confidential pods limitations, section
"Per-pod outbound connection limit": each pod that uses the isolated-sandbox runtime class
can hold at most 4096 simultaneous outbound connections per IP address family (IPv4 and IPv6
are counted independently). An iptables rule on the parent instance enforces it by dropping
connection-initiating packets when the pod is at its limit, which stops one pod from filling the
node's connection-tracking table and denying network access to the other pods on the instance.
The guide names the same symptom this blueprint shows: "new connections timing out during traffic
spikes while existing connections continue to work."
The probe opens concurrent outbound TCP connections to an in-cluster sink and holds each open,
pinning one tracked flow per connection. It connects by raw IP and does no name lookup, so it
cannot reach the DNS limit; the only thing it exercises is outbound flows. It reports the
plateau: the count at which new connections stop completing. A refused connection is instant
(ECONNREFUSED); a dropped connection-initiating packet hangs and times out (ETIMEDOUT), so the
timeout is the shape of the limit. The probe raises its own open-file limit first, so
file-descriptor exhaustion cannot be mistaken for the connection limit, and it reads the guest's
own connection-tracking count so the plateau can be shown as a table at its limit.
Step C1: Deploy the sink and run the comparison. The sink is an ordinary pod that accepts and holds every inbound TCP connection open, so a client's concurrent established-connection count is bounded by the client side, the connection limit on the sandboxed probe, and never by the sink. The egress policy already allows the probe pods to reach the sink on TCP 9000. Run the whole comparison:
scripts/run-conntrack-comparison.sh
sink pod IP: 192.168.106.177

=== CONTROL: ordinary probe opens up to 6000 outbound flows to the sink ===
established=6000 first-fail-errno=NONE

=== SYMPTOM: sandboxed probe opens up to 6000 outbound flows to the sink ===
established=4096 first-fail-errno=ETIMEDOUT conntrack-count-at-plateau=4097

=== Results ===
standard, up to 6000 flows (control)           established=6000 new-conn=NONE
sandbox,  up to 6000 flows (symptom)           established=4096 new-conn=ETIMEDOUT ct=4097

=== Verdict ===
RESULT: the per-pod outbound connection limit bites on the sandbox path and not on the
ordinary path. The ordinary control opened 6000 flows with no drop; the sandboxed
probe plateaued at 4096 established flows, the next connection timed out (ETIMEDOUT),
and the guest connection-tracking count read 4097 at the plateau, near the documented
4096 per family (EKS User Guide).
The block is abridged: it starts at sink pod IP:. Before that the script reuses the
blueprint's namespace, deletes the pods left from an earlier run, and applies the policy, the
sink and the two probe pods.
The ordinary control opens all 6000 flows against the same sink with no drop, so neither the sink nor port exhaustion is the limit (4096 is far below the roughly 28000 ephemeral ports available). The sandboxed pod plateaus at exactly 4096 established flows, which matches the documented 4096 per family; the 4097th connection times out rather than being refused, the dropped-packet shape the User Guide describes; and the guest's own connection-tracking count reads 4097 at that moment, sitting at the limit (4097 against the documented 4096) as the next connection times out. That reads as a full connection-tracking table, not as one connection that happened to fail.
Optional: raise the connection limit
The User Guide documents a per-pod annotation that sets this limit,
sandbox.amazonaws.com/conntrack-limit (an integer between 64 and 65536; unlike the other
throttles it has no off switch).
deploy/probe-sandboxed-conntrack-raised.yaml is
probe-sandboxed with that annotation set to 8192:
metadata:
  name: probe-sandboxed-conntrack-raised
  annotations:
    sandbox.amazonaws.com/conntrack-limit: "8192"
spec:
  runtimeClassName: isolated-sandbox
Run the comparison with the raised variant added:
scripts/run-conntrack-comparison.sh --raised
=== Results ===
standard, up to 6000 flows (control)           established=6000 new-conn=NONE
sandbox,  up to 6000 flows (symptom)           established=4096 new-conn=ETIMEDOUT ct=4097
sandbox,  limit raised to 8192                 established=6000 new-conn=NONE ct=-1
The block is abridged to the === Results === table. The script's output before it is as in
Step C1, plus the raised pod; after it comes the same verdict, with one line on the raised pod.
The default-limit pod still plateaus at 4096, while the pod with the limit raised to 8192 opens
the full 6000 flows the probe offers with no drop (new-conn=NONE), so its limit is above the
offered budget and out of the way. The ct=-1 on that line means no plateau was reached, so there
is no connection-tracking count at a plateau to report. Raising the annotation moves the plateau,
which is direct evidence that the plateau is this limit and not some other bottleneck. To see it
plateau at exactly 8192, raise the probe's offered budget with MAX_CONN=9000, which opens over
eight thousand sockets and takes longer to run.
Recognising the connection limit
When a sandboxed pod shows new connections timing out while established ones stay healthy, this is the check before chasing it as the far end refusing traffic:
- The shape: a sandboxed pod (
runtimeClassName: isolated-sandbox) holding many concurrent outbound connections, where new connections hang and time out while existing connections keep working. A workload that pools and reuses connections is fine; one that opens a fresh connection per request, or a connection-pooling proxy fanning out, reaches it. - The fix is to hold fewer connections, or raise the limit: add connection pooling, lower
idle timeouts, coalesce requests, or shard the workload across more pods. The User Guide
documents the
sandbox.amazonaws.com/conntrack-limitannotation to raise the limit per pod, as the optional variant above shows.
Reading the connection result
As with DNS, the ordinary control classifies any outcome, and the comparison script reads it this way:
| ordinary pod | sandboxed pod | Meaning |
|---|---|---|
| opens the full budget, no drop | plateaus near 4096, new connections time out | The per-pod connection limit bites on the sandbox path, as this blueprint claims. |
| opens the full budget | also opens the full budget | The limit did not show on this cluster under this load, so the build is not enforcing it here. That is a runtime fact, not a sandbox defect, and the page states no number in that case. |
| cannot clear the cap | either | The sink or the path is the bottleneck, not the sandbox. The result cannot be attributed, so the comparison says so rather than blaming the sandbox. |
The comparison script applies exactly this reading and refuses to report a limit unless the control opened the full budget with no drop and the sandboxed pod plateaued near the cap with a connection timeout and the connection-tracking count at its limit.
The sandboxed probe is really in a sandbox
The evidence is the pod's own view: the sandboxed probe runs its own kernel build, its uptime
matches the pod's age because the VM booted with the pod, and it sees virtio disks (the last two
are also on the Hello sandbox page). Run
scripts/show-sandbox.sh, or by hand:
for p in probe-sandboxed probe-standard; do
  echo "# $p"
  kubectl -n sandbox-limits exec $p -- sh -c 'uname -rv; cut -d" " -f1 /proc/uptime; ls /sys/block | tr "\n" " "; echo'
done
# probe-sandboxed
6.18.51 #1 SMP PREEMPT_DYNAMIC Thu Oct  1 23:28:07 UTC 2026
72.62
dm-0 vda vdb vdc
# probe-standard
6.18.51 #2 SMP PREEMPT_DYNAMIC Wed Oct  7 22:33:11 UTC 2026
2413.84
dm-0 loop0 loop1 loop2 loop3 loop4 loop5 loop6 loop7 nvme0n1 nvme1n1 zram0
The run printed a space at the end of each disk list; the block trims it.
The sandboxed probe's uptime (about 73 seconds) matches its pod's age, because the VM booted with
the pod, and it sees virtio disks (vda, vdb, vdc); the ordinary probe reports the node's
uptime (about 40 minutes) and the node's loop and nvme devices. The kernel version string is the same
for both, 6.18.51; the build (#1 versus #2, and the date) and the boot are not.
Clean up
Remove the pods, the sink, the policy and the namespace this blueprint created. Either cleanup flag
deletes the whole namespace, so one is enough; each first confirms the namespace carries this
blueprint's sample: sandbox-limits label and refuses to delete one that does not. This does not
touch the cluster-wide enforcement setting from step 1. If you ran an earlier version of this
blueprint, its sandbox-limits namespace predates that label, so delete it once by hand
(kubectl delete namespace sandbox-limits) before running the scripts again.
scripts/run-comparison.sh --cleanup            # DNS walkthrough
scripts/run-conntrack-comparison.sh --cleanup  # connection walkthrough
Or by hand. First confirm the namespace is this blueprint's: the next command must print
sandbox-limits. If it prints nothing, the namespace is not this blueprint's, so delete nothing.
kubectl get namespace sandbox-limits -o jsonpath='{.metadata.labels.sample}{"\n"}'
kubectl delete -f deploy/egress-policy.yaml --ignore-not-found
kubectl delete -f deploy/probe-sandboxed-raised.yaml -f deploy/probe-sandboxed-conntrack-raised.yaml --ignore-not-found
kubectl delete -f deploy/probe-sandboxed.yaml -f deploy/probe-standard.yaml -f deploy/sink.yaml --ignore-not-found
kubectl delete -f deploy/namespace.yaml --ignore-not-found
The network policy enforcement is cluster-wide, and if you enabled it in step 1 this blueprint does
not turn it back off. On a cluster you keep, leave it on (it only enforces policies that select a
pod), or, if nothing else relies on it, turn it off by setting the amazon-vpc-cni ConfigMap's
enable-network-policy-controller back to "false". If it was already on before you started,
leave it. Deleting the cluster removes everything; see the
hello sandbox clean up for removing the namespace
and the cluster.